Question 705016
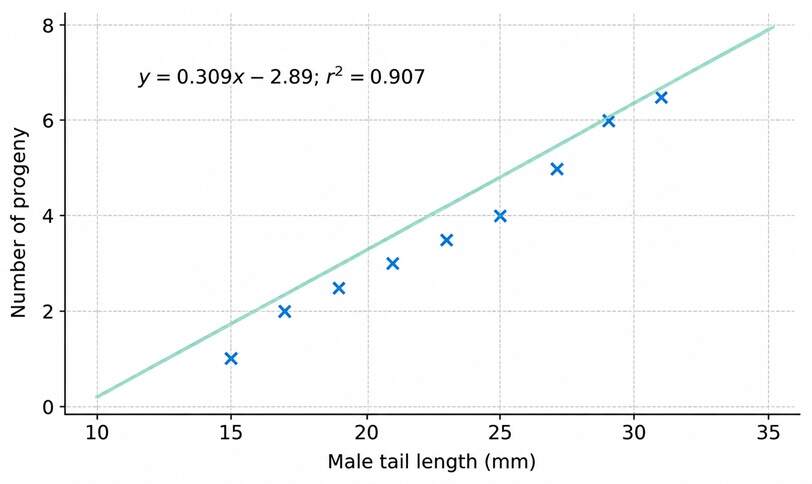
The graph shows observations and a regression line of the number of progeny on the tail length of male birds. Which of the following can be inferred from the graph?
Producing less progeny decreases the tail length of the males.
Males cannot have a tail length lesser than 10 mm.
Males with longer tails tend to father more progeny.
For a male with a 25 mm tail, the expected number of progeny is 4.
Detailed Solution
The regression line shows a positive slope, meaning that as the tail length () increases, the number of progeny () also increases. Therefore, males with longer tails tend to father more progeny.
Boost Your Exam Preparation!
Move beyond just reading solutions. Access our comprehensive Test Series, original Mock Tests, and interactive learning modules. Many premium tests are completely free!
- Original Mocks & Regular Test Series
- Real NTA-like Interface with Analytics
- Many Free Tests Available