Question 5
For a first-order reaction at a given temperature, is the rate constant. For this reaction, at the given temperature, the concentrations of and at a time are and , respectively. The correct graphical representation(s) for this reaction is(are)
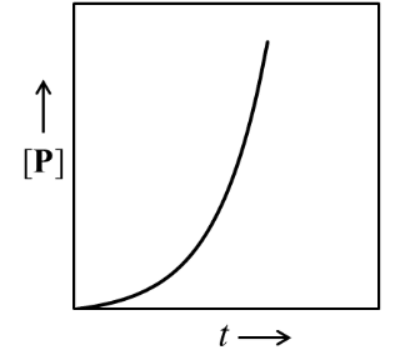
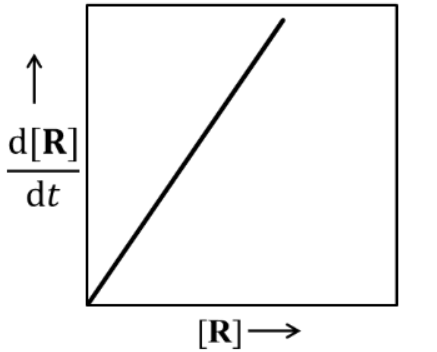
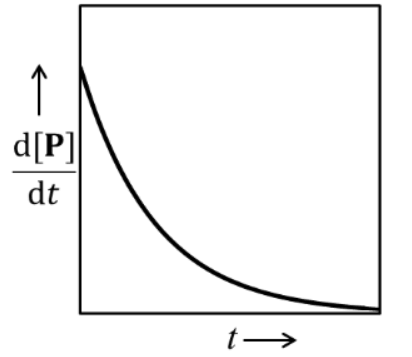
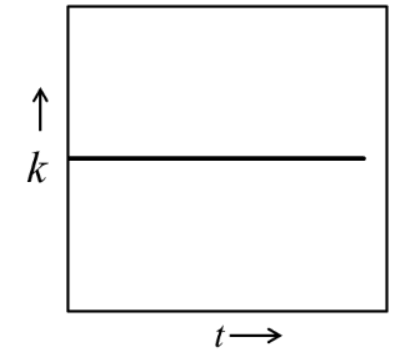
(A) A plot of concentration versus time showing an upwardly concave curve starting from the origin. (B) A plot of the magnitude of rate versus showing a straight line through the origin. (C) A plot of the rate of formation of product versus time showing an exponential decay. (D) A plot of the rate constant versus time showing a horizontal straight line.
Detailed Solution
For a first-order reaction R P:
1. Evaluating Graph (A):
The concentration of the product P at any time is given by the integrated rate law:
As time increases, increases but at a gradually decreasing rate until it reaches a maximum constant value (). The curve should be concave down.
Graph (A) displays an exponential growth curve (concave up, increasing slope), which is incorrect.
2. Evaluating Graph (B):
The rate of disappearance of the reactant R is given by the differential rate law:
Rearranging this for the y-axis variable shown in the graph:
This is an equation of a straight line () passing through the origin, but with a negative slope (). Since is always positive, must be negative.
Graph (B) shows a straight line with a positive slope in the first quadrant, which is mathematically and chemically incorrect.
3. Evaluating Graph (C): The rate of formation of the product P is:
Since for a first-order reaction, substituting this gives:
This equation shows that the rate of product formation exponentially decays with time.
Graph (C) perfectly represents this exponential decay curve. This is correct.
4. Evaluating Graph (D):
The rate constant is a proportionality constant that depends only on the temperature of the reaction. It does not change with the passage of time .
Graph (D) shows as a constant horizontal line parallel to the time axis. This is correct.
Conclusion:
The correct graphical representations are (C) and (D).
Boost Your Exam Preparation!
Move beyond just reading solutions. Access our comprehensive Test Series, original Mock Tests, and interactive learning modules. Many premium tests are completely free!
- Original Mocks & Regular Test Series
- Real NTA-like Interface with Analytics
- Many Free Tests Available